Outdated!
Please be aware that most of the information here is outdated. Updated software can be found in the various VLBI software repositories. In case you are uncertain please contact Uwe Bach.
A few updates on tools for testing VLBI data from various sources
With more and more FlexBuffs, Mark6, and Fila10G around there is the need to test VDIF data as well. Here a summary of a few useful tools to do that. Some tools and procedures for testing were also mentioned in my talk at the TOW in May 2015, therefore you can find the talk here as well. TOW2015_DBBC2_Bach.pdf
mark5access: mark5access-master.zip
The archive contains a README how to compile it. To get the tools that allow to produce spectra and cross-correlate different data channel by channel (zerocorr) the fftw3-dev package has to be installed first. The mark5access libray can analyse Mark4, VLBA, Mark5B and single-threaded VDIF data.
vdifio: vdifio.tar
The vdifio archive contains some programs to work with multi-threaded VDIF data. The README describes how to compile it.
mark5access
If the programms are called without any option a help is displayed. Example data can be downloaded from my outgoing-ftp
ftp://ftp.mpifr-bonn.mpg.de/outgoing/ubach/ft008a/
m5time, to look for the start time of a file.
oper@Mark6-4XXX:~$ m5time

m5time ver. 0.1   Chris Phillips  20120330

A Mark5 dtime ecoder.  Can decode VLBA, Mark3/4, Mark5B and VDIFformats using the
mark5access library.

Usage : m5time <file> <dataformat>

  <file> is the name of the input file

  <dataformat> should be of the form: <FORMAT>-<Mbps>-<nchan>-<nbit>, e.g.:
    VLBA1_2-256-8-2
    MKIV1_4-128-2-1
    Mark5B-512-16-2
    VDIF_1000-64-1-2 (here 1000 is payload size in bytes)
e.g. using 1 Gbps Mark5B data
oper@Mark6-4XXX:~$ m5time mark5b_ef_no0003.m5b Mark5B-1024-16-2
MJD = 57163/14:19:46.00
or the same as VDIF from a FlexBuff:
oper@Mark6-4XXX:~$ m5time fila10g_ef_no0007.vdif VDIF_8000-1024-16-2
MJD = 57163/14:19:46.00
Same time?!? Yes, they were recorded in parallel using a DBBC-Fila10G, a Mark5B+ via VSI cable and a Mark6 via Ethernet from the Fila10G.
m5bstate, to look at bit statistics of 2bit sampled data.
oper@Mark6-4XXX:~$ m5bstate

m5bstate ver. 1.1   Alessandra Bertarini  2011 Sep 12

A Mark5 state counter.  Can use VLBA, Mark3/4, and Mark5B formats using the
mark5access library.

Usage : m5bstate <infile> <dataformat> <nframes> [<offset>]

  <infile> is the name of the input file

  <dataformat> should be of the form: <FORMAT>-<Mbps>-<nchan>-<nbit>, e.g.:
    VLBA1_2-256-8-2
    MKIV1_4-128-2-1
    Mark5B-512-16-2
    VDIF_1000-64-1-2 (here 1000 is payload size in bytes)

  <nframes> is the number of frames to bstate-erize

  <offset> is number of bytes into file to start decoding
Works again with Mark5B and single threaded VDIF data. On a Mark6 or FlexBuff one can analyse directly the files on the disk:
oper@Mark6-4XXX:~$ m5bstate /mnt/disks/1/1/fila10g_ef_no0007/fila10g_ef_no0007.00000001 VDIF_8000-1024-16-2 400
Mark5 stream: 0x1e16140
  stream = File-1/1=/mnt/disks/1/1/fila10g_ef_no0007/fila10g_ef_no0007.00000001
  format = VDIF_8000-1024-16-2 = 3
  start mjd/sec = 57163 51587.992000000
  frame duration = 62500.00 ns
  framenum = 0
  sample rate = 32000000 Hz
  offset = 0
  framebytes = 8032 bytes
  datasize = 8000 bytes
  sample granularity = 1
  frame granularity = 1
  gframens = 62500
  payload offset = 32
  read position = 0
  data window size = 1048576 bytes
800000 / 800000 samples unpacked

Ch    --      -     +     ++        --      -      +     ++     gfact
 0  163383  235251  233669  167697      20.4   29.4   29.2   21.0   0.90
 1  162434  236497  234585  166484      20.3   29.6   29.3   20.8   0.90
 2  163582  236301  233552  166565      20.4   29.5   29.2   20.8   0.90
 3  163226  233540  235357  167877      20.4   29.2   29.4   21.0   0.90
 4  152756  245902  243400  157942      19.1   30.7   30.4   19.7   0.95
 5  154613  244458  241193  159736      19.3   30.6   30.1   20.0   0.94
 6  153708  242865  245140  158287      19.2   30.4   30.6   19.8   0.94
 7  155774  243940  242134  158152      19.5   30.5   30.3   19.8   0.94
 8  163888  234490  233171  168451      20.5   29.3   29.1   21.1   0.89
 9  163315  235803  233493  167389      20.4   29.5   29.2   20.9   0.90
10  163245  236056  233433  167266      20.4   29.5   29.2   20.9   0.90
11  163424  236910  232394  167272      20.4   29.6   29.0   20.9   0.90
12  154180  246366  242083  157371      19.3   30.8   30.3   19.7   0.95
13  153998  246461  241608  157933      19.2   30.8   30.2   19.7   0.94
14  155434  244888  240448  159230      19.4   30.6   30.1   19.9   0.94
15  154623  242114  243859  159404      19.3   30.3   30.5   19.9   0.94
m5spec, useful for generating autocorrelation spectra.
oper@Mark6-4XXX:~$ m5spec

m5spec ver. 1.3.1   Walter Brisken, Chris Phillips  20120508

A Mark5 spectrometer.  Can use VLBA, Mark3/4, and Mark5B formats using the
mark5access library.

Usage : m5spec <infile> <dataformat> <nchan> <nint> <outfile> [<offset>]

  <infile> is the name of the input file

  <dataformat> should be of the form: <FORMAT>-<Mbps>-<nchan>-<nbit>, e.g.:
    VLBA1_2-256-8-2
    MKIV1_4-128-2-1
    Mark5B-512-16-2
    VDIF_1000-64-1-2 (here 1000 is payload size in bytes)

  <nchan> is the number of channels to make per IF

  <nint> is the number of FFT frames to spectrometize

  <outfile> is the name of the output file

  <offset> is number of bytes into file to start decoding


The following options are supported

    -dbbc      Assume dBBC polarisation order (all Rcp then all Lcp)

    -nopol     Do not compute cross pol terms

    -help      This list
Contrary to vlbi2 or vlbi0 this program doesn't produce a plot directly, but a text file that can be plotted using e.g. gnuplot.
oper@Mark6-4XXX:~$ m5spec fila10g_ef_no0007.vdif VDIF_8000-1024-16-2 2000 1000 spec.out
Mark5 stream: 0x1293140
  stream = File-1/1=fila10g_ef_no0007.vdif
  format = VDIF_8000-1024-16-2 = 3
  start mjd/sec = 57163 51586.000000000
  frame duration = 62500.00 ns
  framenum = 0
  sample rate = 32000000 Hz
  offset = 0
  framebytes = 8032 bytes
  datasize = 8000 bytes
  sample granularity = 1
  frame granularity = 1
  gframens = 62500
  payload offset = 32
  read position = 0
  data window size = 1048576 bytes
4000000 / 4000000 samples unpacked
The output file contains, frequencies steps, and normalized counts for all channels and cross-polarization products.
oper@Mark6-4XXX:~$ head spec.out |colrm 74
0.000000  0.605838 0.615841 0.531392 0.714017 0.614041 0.523255 0.762737 ...
0.008000  0.440312 0.457041 0.430808 0.450272 0.469477 0.455154 0.455742 ...
0.016000  0.445765 0.463676 0.444722 0.456570 0.452735 0.484150 0.451007 ...
0.024000  0.456951 0.445335 0.443271 0.463813 0.436771 0.451684 0.438498 ...
0.032000  0.440797 0.456812 0.435363 0.459172 0.437911 0.454227 0.429665 ...
0.040000  0.462612 0.474406 0.439176 0.453362 0.443758 0.454391 0.443518 ...
0.048000  0.445282 0.435614 0.455072 0.437838 0.447920 0.466380 0.430216 ...
0.056000  0.449132 0.442534 0.426156 0.432797 0.430959 0.444511 0.422540 ...
0.064000  0.429922 0.447915 0.449783 0.440142 0.434226 0.452526 0.414590 ...
0.072000  0.455532 0.464773 0.454600 0.442910 0.416202 0.446813 0.443168 ...
zerocorr, to correlate two different files from two different backends or recorders. It has the limitation that one can only correlate channel by channel, but the channels can be freely selected. Therefore one can also correlate data that doesn't have the same track order. zerocorr is a bit more complicated to set up because it needs a parameter file with some lines of information and produces two file, a visibility file with the correlation, and a lag-file with the delay information.
oper@Mark6-4XXX:~$ zerocorr

zerocorr ver. 0.2   Walter Brisken  20110926

A zero baseline cross correlator

Usage: zerocorr [ <options> ] <conf file>

options can include:

  --help
  -h         Print this help information and quit

  --verbose
  -v         Increase the output verbosity

The conf file should have 17 lines as follows:

For the first datastream:
   1  Input baseband data file name
   2  Input format (e.g., Mark5B-2048-16-2)
   3  Input sub-band to process (0-based index)
   4  Offset into the file (bytes)
   5  Size of FFT to perform over the original bandwidth
   6  First channel (spectral point) to correlate
   7  Number of channels to correlate (negative for LSB)
For the second datastream:
   8  Input baseband data file name
   9  Input format (e.g., Mark5B-2048-16-2)
  10  Input sub-band to process (0-based index)
  11  Offset into the file (bytes)
  12  Size of FFT to perform over the original bandwidth
  13  First channel to correlate
  14  Number of channels to correlate (negative for LSB)
Other general parameters:
  15  Name of output visibility file
  16  Name of output lag file
  17  Number of FFTs to process (if -1, run on entire input files)

The visibility output file (specified in line 15 above) has 8 columns:
   1  Channel (spectral point) number
   2  Frequency relative to first spectral channel (Hz)
   3  Real value of the visibility
   4  Imaginary value of the visibility
   5  Amplitude
   6  Phase
   7  Autocorrelation of the first datastream (real only)
   8  Autocorrelation of the second datastream (real only)

The lags output file (specified in line 16 above) has 7 columns:
   1  Channel (spectral point) number
   2  Time lag (sec)
   3  Real value of the lag function
   4  Imaginary value of the lag function
   5  Amplitude
   6  Phase
   7  Window function

Control-C will stop this program after the next FFT is completed and
will write the partial results to the output files.
An example file is also on the outgoing-ftp mentioned above. It contains:
oper@eff-mark5c-1:~$ cat zerocorr.par
fila10g_ef_no0007.vdif
VDIF_8000-1024-16-2
0
0
1024
0
512
mark5b_ef_no0003.m5b
Mark5B-1024-16-2
4
0
1024
0
512
zerocorr.vis
zerocorr.lag
20000
Have fun with that, if there are questions don't hesitate to ask me (Uwe Bach).
DBBC Worshop documents from the TOG in Bonn, May 2013
Datacheck procedure for Mark5B
During testing and operation of the DBBC, specially at the beginning, it is good to verify that everything is okay. Usually I used the Mark5B tools from Haystack like bpcal, bstat, vlbi2 or vlbi0. Those work, but are mostly written for 2 Gbps PFB tests, or other 16 channel observation, and therefore can give confusing outputs when used with less channels.
During the TOG in Onsala Alessandra introduced the mark5access package.The mark5access package is much more flexible and can be used for all kind of VLBI data formats, like Mark5A, B, VLBA, or MarkIV and even some VDIF is supported. At the workshop in Bonn we had the idea to make an online display of VLBI data during recording.
Since the mark5access programs have to be called with the correct mode this was a bit complicated at the beginning. I tried to prepare scripts for the most common modes and attached those to each prc-file of an observation, but this needs an additional step after drudging and was a bit complicated.
As a result of the discussion at the TOG in Wettzelll I've now written a small python script that sorts out the required information from the current log file and prepares a shell script and a plot file for gnuplot. After some interation with Jonathan this script is now in a shape that we think it can be used by a wider comunity. It is still not real time, but it can be executed after every scan in checkmk5 and does a check of the first few bytes from the last scan. It just uses a basic python installation (an old 2.4 works as well), the mark5access package, gnuplot, and/or gv (gv is optional).
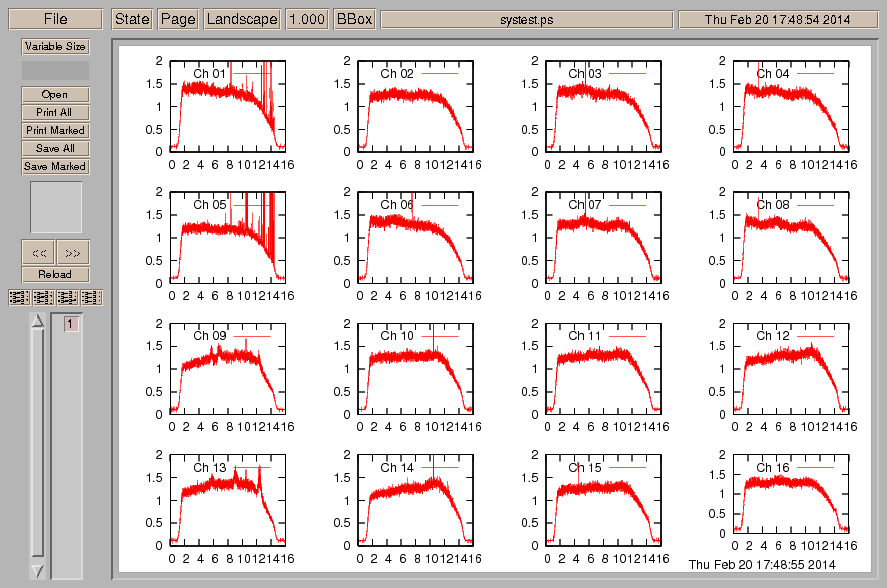
gnuplot and mark5access should be installed on the Mark5B recorder and if you prefer postscript figures also gv. Since the FS PC has usually password free access to the Mark5 recorder one can execute programs via ssh. For now you get autocorrelation plot of all BBCs and the bit statistics (see images below). The checkdata.py script gets the IP address from the mk5ad.ctl.
Once the mode has been detected the checkdata.py copies a plot-file for gnuplot to the Mark5 using 'scp'. Then an 'ssh -f' command is issued that runs m5spec, m5bstate, and gnuplot on the Mark5, open a plot using gv, and kills this plot after 1 min. The complete command can be found at the end of the checkdata.py script. A printout of the commands would look like this:
ssh -f -X mark5-671 'm5spec systest.m5b Mark5B-512-16-2 4000 1024 spec.out -dbbc > m5spec.tmp;gnuplot < plot_16x8ul_DBBC_all; m5bstate systest.m5b Mark5B-512-16-2 200 | tee -a m5bstate.log ;gv systest.ps > & /dev/null & ; sleep 60 ; pkill gv' &
Note that the syntax is for csh, which usually runs on the Mark5. If you use bash the syntax needs to be changed.
If all the software is in place there is not much needed than adding a few lines to the checkmk5 procedure in your stations.prc to get it running. The installation of the mark5access package is explained in the INSTALL note within the tar-archive. I just had to install the fftw3 libraries to run it. The python script 'checkdata.py' should go to /home/oper/bin. The files are attached at the end of this page.
This is my new checkmk5 procedure:
define checkmk5 00000000000x
mk5=rtime?
scan_check
data_check
disk_stats
mk5=dir_info?
mk5=vsn?
mk5=disk_serial?
mk5=bank_set?
" query needed for checkdata.py
mk5b_mode
form
" write out some bytes from beginning of the last scan
!+1s
mk5=scan_set=::+20000000
!+1s
mk5=disk2file=systest.m5b:::w
!+3s
" run checkdata
sy=exec /home/oper/bin/checkdata.py `lognm` systest.m5b &
"
enddef
So first, a protion (20 MB) of data from the last scan are written to the disk. Then the python script is executed with the logfile and the data file name as an input paramter. In Effelsberg we use the oper home directory, if you prefer /tmp you need to choose that in disk2file and as an input parameter to checkdata.py.
The statistics are stored in a file, like 'exp-code.bstate', but all the other files that are written have always the same name and will be overwritten with the next scan, so it doesn't fill your disk id it runs for a complete EVN session. If somebody want to save those one could change the script to give them individual names. There are some individual options at the start of the script that you might want to edit.
# Option: include a timestamp on last graph?
timestamp=1
# Option: Use gv of a postscript output file instead of a gnuplot_x11 display
postscript=0
# Option: Time to display output for (seconds, use 0 for a persistent window)
display_time=60
# Option: display m5bstate statistics for 2-bit data
m5bstate=1
# Option: print out some debug info about the recording format and BBC settings found
fmt_debug=1
For now I haven't add much information about the channels to the plots, but one could think of adding the correct sky frequencies as labels. The information could come form the prc-file, but as I tried that I gave up with observation that use more than one mode and one has to look which setup is used. Maybe I'll add this later.
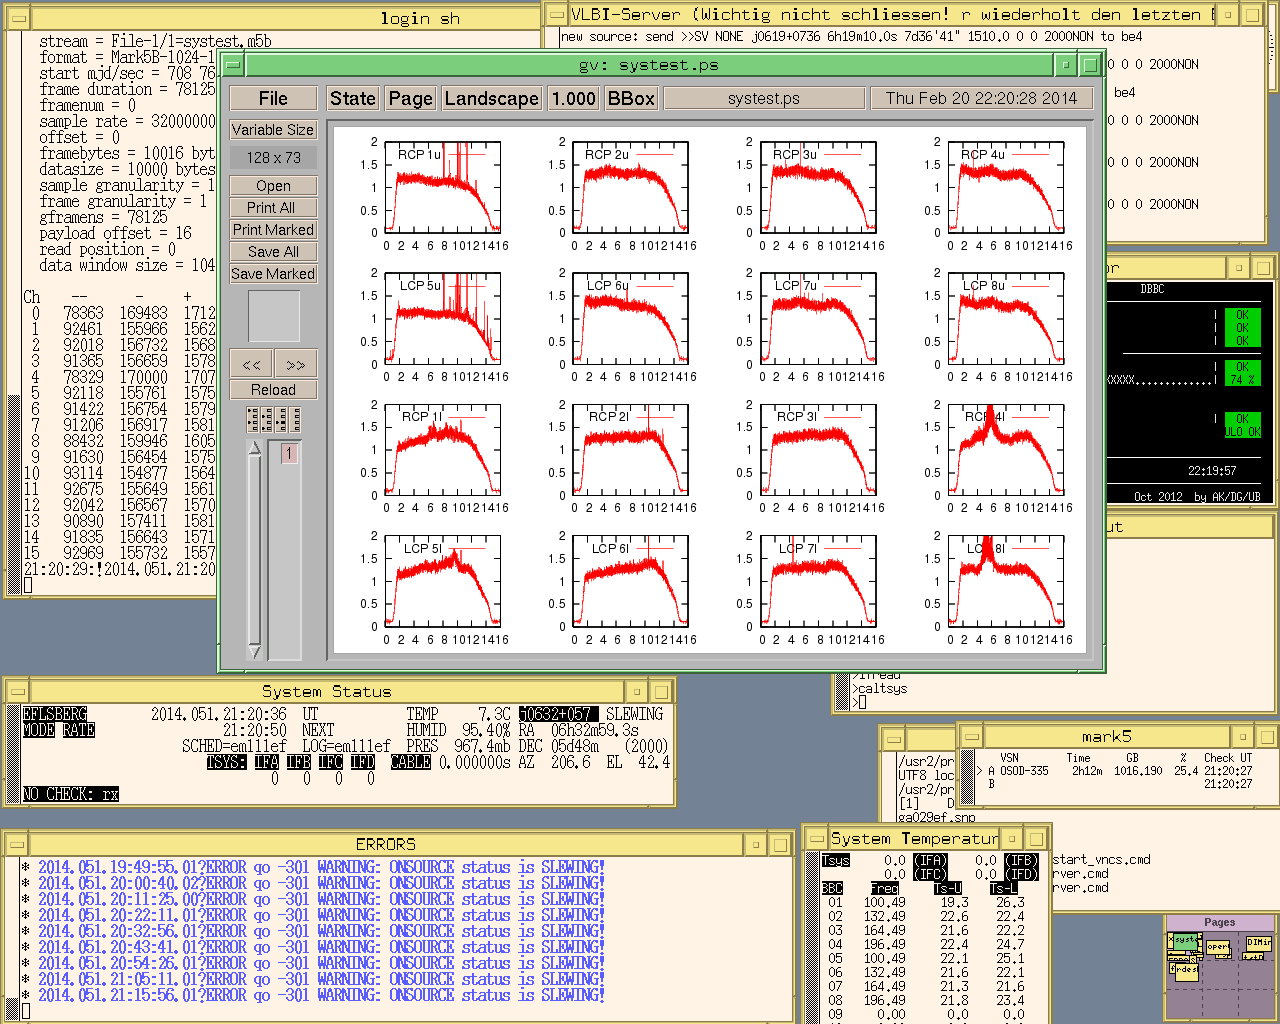
Fig. 1: Here is a snapshot of the FS screen during a 1 Gbps 18cm observation with a lot of RFI.
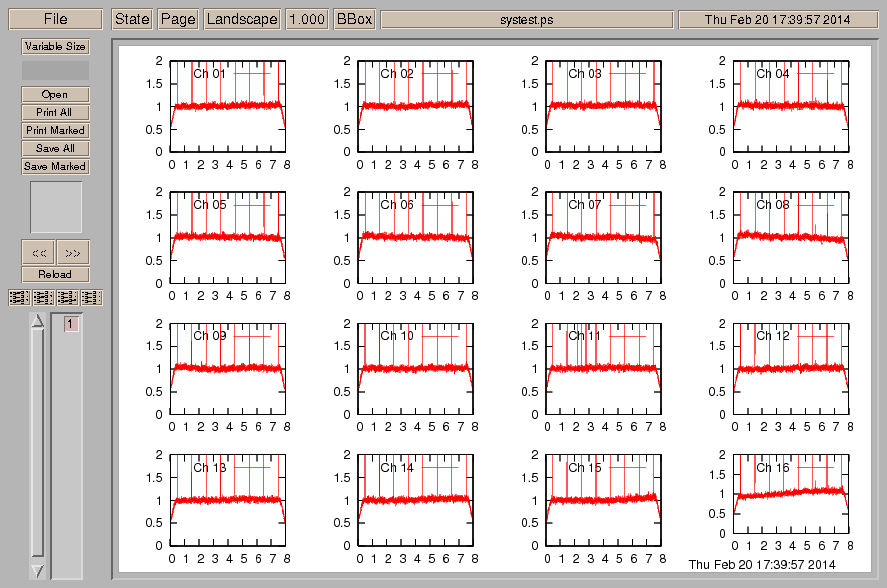
Fig. 2: This plot is from N13C1 with 8 MHz filters and phasecal on.
/@api/deki/files/4326/=mark5access-1.4.5.tar.gz
/@api/deki/files/4389/=checkdata.py
Acknowledgment
Thanks to Jonathan Quick for the initial idea and for sending me the mark5access package and some gnuplot scripts to look at DBBC data.
Checking Phases from the DBBC
The goal of this second section is to show a method to verify the stability of the phases of the different channels in the DBBC at the stations using a DBBC, a Mark5B and a diskpack. A phase cal system inject tones at the receiver is required. We have developed this small test because we found that our DBBC at Yebes was producing fringes with lower quality than the ones obtained with the VLBA terminal. Phase jumps were seen along time at the correlator for some bands.
The basic idea of this test is to use the phase cal tones injected in the receiver and monitor the phase of one tone along time. The script included here uses a geodetic setup: X band and S band feeding IFs 1 and 2 and 3 and 4 respectively. The data are recorded for some minutes. Later some slots of data, 1 second long and spaced 30 seconds or 1 minute, are extracted in the Mark5B. bpcal is ran on top of the data and the phases for all channels and a selected tone are written on an ASCII file and plotted with gnuplot.
This procedure requires a modification in station.prc and a python script to run the whole process. The new procedure in station.prc is called phasecalvsti and it is attached at the bottom. phasecalvsti triggers an external python script, checkphases.py, which extracts the data and plots the results. checkphases.py should be placed in /usr2/oper/bin. The selected tone to monitor its phase is 2010 KHz. The tone can be changed in the previous procedure.
In order to make this check work, gnuplot should be installed in the FS computer and bpcal should be installed in the mark5B. bpcal can be obatined from Haystack web: ftp://web.haystack.mit.edu/pub/mark5/B/util/
The current procedure lasts 8 minutes and blocks the FS for that time. At the end a plot will be shown in the screen and it is required to click on the plot to close it and to press enter in the log window.
A typical result from Yebes DBBC which shows some phase jumps in some of the channels is depicted below. In a DBBC without problems all lines should be flat with time, that is, phase of the phase tones should remain stable.
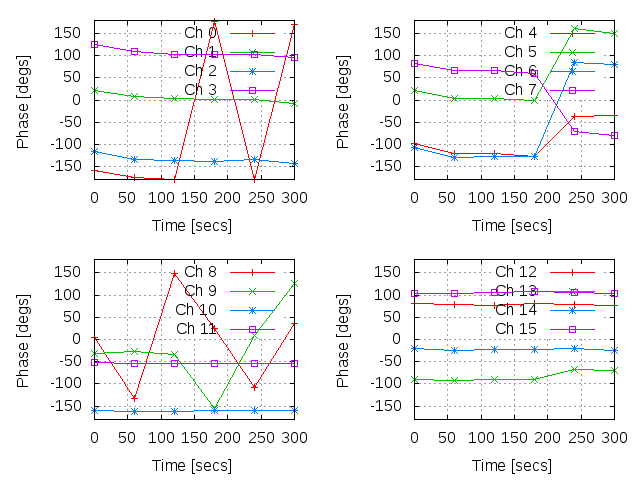
The previous plot shows jumps in channel 0 (BBC01 USB) because of the ambiguity of the phase close to +- 180 degrees. Channels 4 to 7 do have problems and point to something wrong in the 2nd block (ADB+CORE) of the DBBC. Channels 8 and 9 should be disregarded because in geodesy they correspond to LSB (lower side band) and when mixing the tones with the local oscillator, no signal with a frequency multiple of 1 MHz plus 10 KHz is available.
Before using this method it should be checked that the phase cal is on and it is working correctly. The Mark5B should be using a 2 bit scheme. All this settings are in phasecalvsti.
The procedure in station.prc is prepared for a DBBC with 3 ADB1 boards and 4 CORES. If your setting is different the procedure should be modified accordingly. It is also possible to change the time resolution and the time duration.


Comments