Table of contents
- Everytime a new DBC firmware version is installed (PFB or tunable) the calibration parameters must be determined.
- Calibration should also be repeated regularly to verify that the system is stable.
Calibration Procedure
1) Inject a broad band noise signal into all of the DBBC boards.
2) Start the DBBC control software (PFB or DDC), confirm re-programing of the FPGA and wait until programming of the boards is finished
3) Adjust the IF power levels to around 10000 (or less)
- PFB and DDC mode
In the DBBC2 client manually set the attenuation (e.g. 40) until you reach a target of 10000 counts.
dbbcifa=1,40,1
Check the counts with:
dbbcifa
Alternatively you can let the AGC adjust the attenuation and set it to manual when the correct level is reached.
dbbcifa=1,agc,1,10000
Check the counts with:
dbbcifa
Once 10000 counts are reached just command
dbbcifa=1,man,1
Check again with :
dbbcifa
Change attenuation and repeat until the target has been reached. Repeat for all boards.
-
DDC mode only
In addition for the DDC mode the AGC of the BBCs have to be turned of as well with:
dbbcgain=all,20,20
Typical BBC level is a few hundred counts. Check for some BBCs, e.g.
dbbc01
Reply: dbbc01/ 598.0,a,16,1,man,20,20,385,418,0,0
dbbc05
Reply: dbbc05/ 598.0,b,16,1,man,20,20,354,387,0,0
4) Start the calibration
- PFB mode:
calibration
- DDC mode (with an equal numbers of ADBs and Core2Boards):
calibration=all
- DDC mode (with less ADBs than Core2Borads, 2 ADB / 4 Core2B):
Here you first have to calibrate Boards 1 and 3:
calibration=1,3
This will produce a file in C:\ which is named {DATE}-calib.txt that contains the calibration results (one column for each board). See point 5) how to find the correct phase values. Enter these values for 1 and 3 in the config-file and as phase values into the control software (phase=1,<value> phase=3,<value>). Continue with Boards 2 and 4:
calibration=2,4
This will produce again a file in C:\ which is named {DATE}-calib.txt that contains the calibration results (one column for each board).
5) Determine the calibration values
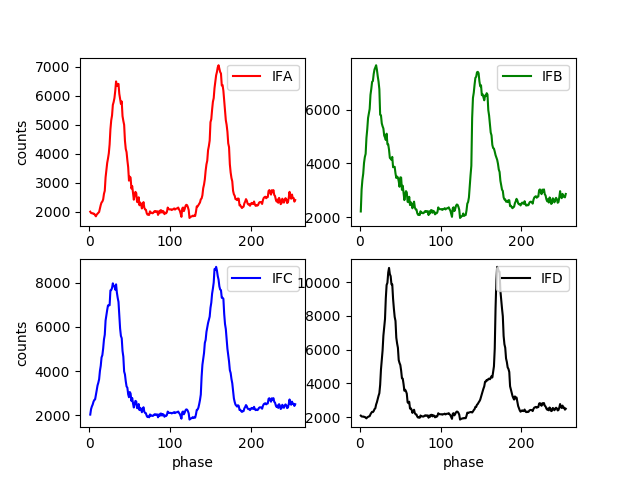
Inspect/plot the calibration result file and search for the minimum between the two peaks (see example plots below). Determine the value on the x-axis where the minimum occurs (between 0-255) for all the boards. Please do not use the values reported by the calibration procedure itself that are printed in the command window. These are usually not between the two peaks.
Insert the minimum values into the configuration file e.g. c:\DBBC_CONF\dbbc_config_file_104.txt (file name varies depending on the version). Edit the line just above CAT2 entry.
An example of for a calibration plot is shown below, as well as the script to produce such plots (calibration_plot.py).
Usage:
calibration_plot.py BOARD_ALL-2019-009T160419-calib.txt
to zoom into a specific region additional limits for x and y can be given: e.g.
calibration_plot.py BOARD_ALL-2019-009T160419-calib.txt xlim=50,150 ylim=1500,3000
In this case good phase values for all boards would be in the range 90 to 100.
6) Activate the new calibration
- (When restarting the control software the new calibration values in the config file will be applied.) For version V107 the restart of the control software also resets the DCM (clock manager) and this can cause another jump in the phase calibration. The same happens when commanding a "restall". To avoid this it is better to enter the values manually as described in the next paragraph.
- In case you do not want to restart the control software you can set the calibration values manually:
phase=board,value
This has to be done for all boards.

Comments