Table of contents
C211D Correlation Report
General Information
- Session info: http://www3.mpifr-bonn.mpg.de/div/vlbi/globalmm/
- Station feedback: http://www3.mpifr-bonn.mpg.de/div/vlbi/globalmm/sessions/apr21/feedback_apr21.asc
Preliminary Correlation Info and Fringes
Continuum correlation 1 (86 GHz)
It includes only a subset of stations, Aa, Ef, Pv and two of VLBA: Br and Fd. For technical reasons the correlation performed for all antennas only in two 58MHz bands: starting at 86209.703125 MHz and at 86268.296875 MHz (where Aa, Ef and VLBA bands overlap). For VLBA and ALMA only two additional 58MHz bands are added below and above (they don't work for Ef with its 64Mhz x 8 configurations).
At the moment we are not concerned with the linear polarization of ALMA, its "R" and "L" are arbitrarily reassigned X and Y, and the strength of its parralel and cross-hands fringes is roughly the same, as it should be.
Fringes detected from all stations (except Pico, its data for this experiment is useless, it was recording while stowed) only to ALMA and only for calibrators: 1055+018, OJ287, 4C39.25. There is a significant non-linear behavior in fringe rate: being fully compensated in scan 1 it increases to a significant value in scan 22 (130+ mHz or in d-rate units 1600 fs/s). It is not a real cause for concern (if we compensate it in the middle of the experiment, it won't lead to large single-band delays because this is a short experiment), but should be noted.
Map of the currently detected ALMA fringes in the context of the whole experiment:
c211d_FRINGE_RfAnt_Aa_LLRR_AllSrc.pdf
Full fringe plot sets (to ALMA only) for a few scans with the brightest fringes (including autocorrelations and antennas with no fringes):
No0001_A.pdf (1055+018)
No0003_A.pdf (OJ287)
No0014_A.pdf (4C39.25)
No0017_A.pdf (1055+018)
No0022_A.pdf (OJ287)
continuum correlation (88 GHz)
Scan No0025 was observed on 3C273. In order to verify fringe detections to all stations a continuum correlation was done on this scan. In a first attempt a VLBA-only correlation was done without using any zoom/output bands. Fringes were detected for these stations: Br, FD, KP, LA, OV, PT. No fringes found for MK and NL despite using clock values that led to fringes in parts c211a, c211b c211c. NL generally had weak fringes in all other parts and MK dropped out of the observations regularly for the USNO time.
GL did not participate in c211d.
Preliminary Line Correlations
attempt 1
All 4 line sources were correlated in all scans, that is scans No0002, No0004, No0005, No0008, No0010, No0011, No0012, No0013, No0015, No0016, No0018, No0019, No0020, No0021.
This correlation included ALMA, Ef, Pv (as control, knowing that it has no real signal), and 6 VLBA stations: Br, Fd, Mk, Nl, Ov, Pt.
The correlation frequency window was 86231 - 86236 MHz, fringe search window 86232.5 - 86234 MHz.
The following are some fringe plot examples:
RLEO: No0002_all.pdf, No0021_all.pdf
RLMI: No0013_all.pdf, No0015_all.pdf, No0016_all.pdf (including all stations)
VYCMA: No0019_all.pdf
RCNC: No0020_all.pdf
Unfortunatly, the problem with difx2mark4 / fourfit persists and so not all autocorrelations and baselines are available in these plots.
In general it seems, that ALMA successfully detects the spectral line in some cases, as seen in autocorrelation plots for RLEO and RLMI, however the crosscorrelation "fringes" with other stations are just artefacts created by fourfit, as confirmed by low SNR, random values of single-band delay (reliable clocks have already been established in continuum correlation), the shape of the "line" in cross-corr plots (basically just amplified noise spikes) and the fact that they are detected even for Pv, which must have no meaningful signal.
attempt 2
The correlation included the same stations with exception of Pv. A continuum correlation was performed for Mh, but no fringes were found, so it was not included in the line correlation.
To fix the problem with the difx2mark4 / fourfit, 8 zoom bands were created to cover all 64 MHz bands of the EVN configuration (and. of course, also 128 MHz bands of the VLBA) and overlap well with ALMA 62.5 MHz bands. Only the 4th one (band d in fourfit designations) is of interest, approximately centered at the line.
ZOOM narrow {
    addZoomFreq = freq@86045.000000/bw@12.0/noparent@true
    addZoomFreq = freq@86105.000000/bw@12.0/noparent@true
    addZoomFreq = freq@86165.000000/bw@12.0/noparent@true
    addZoomFreq = freq@86227.000000/bw@12.0/noparent@true # this one real
    addZoomFreq = freq@86295.000000/bw@12.0/noparent@true
    addZoomFreq = freq@86355.000000/bw@12.0/noparent@true
    addZoomFreq = freq@86415.000000/bw@12.0/noparent@true
    addZoomFreq = freq@86465.000000/bw@12.0/noparent@true
}
This time all autoccorelations and cross-correlations for all baselines, including VLBA stations with each other, were processed by fourfit with no problem. The full sets of fourfit plots are below, fringe search was performed in the passband of 86231.5 - 86235 MHz.
RLEO: No0002_all.pdf, No0004_all.pdf, No0005_all.pdf, No0010_all.pdf, No0021_all.pdf
RLMI: No0008_all.pdf, No0011_all.pdf, No0012_all.pdf
No0013_all.pdf, No0015_all.pdf, No0016_all.pdf (including all stations)
RCNC: No0020_all.pdf
No clear fringes were found yet, however in the autocorrelations of scans No0002 and No0004 the line is clearly visible in acutocorrs for Aa and Ef, and in scan No0021 — for Fd and Ov. And several cross-correlation plots show what seems to be a line profile, but with wrong delays.
One reasonable candidate for a cross-correlation fringe is the following:
c211d_No0013_RLMI_Ao_XL.pdf
Looking at the same data with AIPS (it is a later correlation with slightly different parameters) provides the last bit of confirmation, that line shapes in some cross-correlation spectral analysis represent true if weak fringes: not only there is a peak at the right frequency, the phase also stabilizes for a few channels. Here's a good example of this:
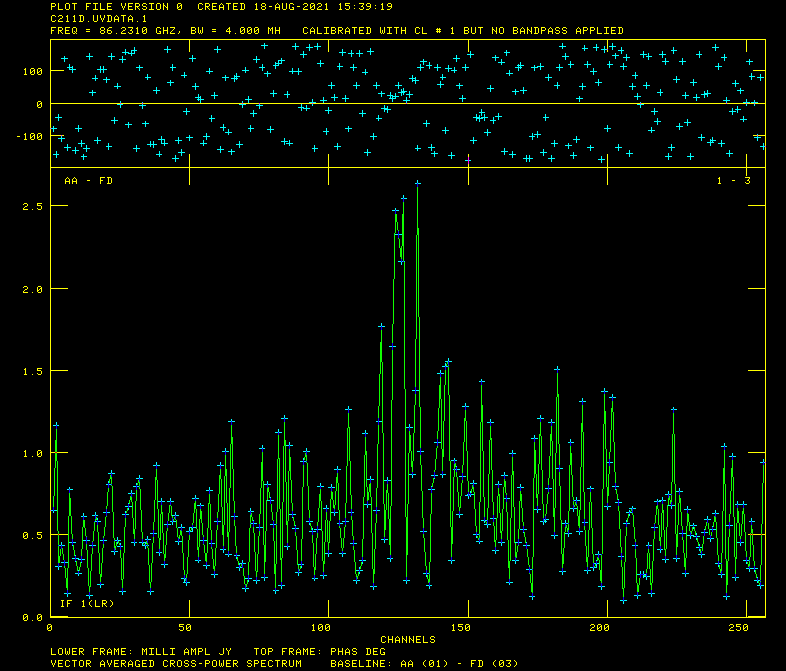
Production Correlation Fringes
| Station | Code | Fringes | Plots | Comments |
|---|---|---|---|---|