Table of contents
Datacheck procedure for Mark5B
During testing and operation of the DBBC, specially at the beginning, it is good to verify that everything is okay. Usually I used the Mark5B tools from Haystack like bpcal, bstat, vlbi2 or vlbi0. Those work, but are mostly written for 2 Gbps PFB tests, or other 16 channel observation, and therefore can give confusing outputs when used with less channels.
During the TOG in Onsala Alessandra introduced the mark5access package.The mark5access package is much more flexible and can be used for all kind of VLBI data formats, like Mark5A, B, VLBA, or MarkIV and even some VDIF is supported. At the workshop in Bonn we had the idea to make an online display of VLBI data during recording.
Since the mark5access programs have to be called with the correct mode this was a bit complicated at the beginning. I tried to prepare scripts for the most common modes and attached those to each prc-file of an observation, but this needs an additional step after drudging and was a bit complicated.
As a result of the discussion at the TOG in Wettzelll I've now written a small python script that sorts out the required information from the current log file and prepares a shell script and a plot file for gnuplot. It is still not real time, but it can be executed after every scan in checkmk5 and does a check of the first few bytes from the last scan. It just uses a basic python installation (an old 2.4 works as well), the mark5access package, gnuplot, and gv. The IP of your Mark5 has to be written into the python script checkdata.py.
gnuplot, gv, and mark5access should be installed on the Mark5B recorder. Since the FS PC has usually password free access to the Mark5 recorder one can execute programs via ssh. For now you get autocorrelation plot of all BBCs and the bit statistics (see images below).
Once the mode has been detected the checkdata.py copies a plot-file for gnuplot to the Mark5 using 'scp'. Then an 'ssh -f' command is issued that runs m5spec, m5bstate, and gnuplot on the Mark5, open a plot using gv, and kills this plot after 1 min. The complete command can be found at the end of the checkdata.py script. A printout of the commands would look like this:
ssh -f -X mark5-671 'm5spec systest.m5b Mark5B-512-16-2 4000 1024 spec.out -dbbc > m5spec.tmp;gnuplot < plot_16x8ul_DBBC_all; m5bstate systest.m5b Mark5B-512-16-2 200 | tee -a m5bstate.log ;gv systest.ps > & /dev/null & ; sleep 60 ; pkill gv' &
Note that the syntax is for csh, which usually runs on the Mark5. If you use bash the syntax needs to be changed.
If all the software is in place there is not much needed than adding a few lines to the checkmk5 procedure in your stations.prc to get it running. The installation of the mark5access package is explained in the INSTALL note within the tar-archive. I just had to install the fftw3 libraries to run it. The python script 'checkdata.py' should go to /home/oper/bin. The files are attached at the end of this page.
This is my new checkmk5 procedure:
define checkmk5 00000000000x
mk5=rtime?
scan_check
data_check
disk_stats
mk5=dir_info?
mk5=vsn?
mk5=disk_serial?
mk5=bank_set?
" query needed for checkdata.py
mk5b_mode
form
" write out some bytes from beginning of the last scan
!+1s
mk5=scan_set=::+20000000
!+1s
mk5=disk2file=systest.m5b:::w
!+3s
" run checkdata
sy=exec /home/oper/bin/checkdata.py `lognm` &
"
enddef
So first, a protion (20 MB) of data from the last scan are written to the disk. Then the python script is executed with the logfile name as an input paramter. The statistics are stored in a file, like 'exp-code.bstate', but all the other files that are written have always the same name and will be overwritten with the next scan, so it doesn't fill your disk id it runs for a complete EVN session. If somebody want to save those one could change the script to give them individual names.
For now I haven't add much information about the channels to the plots, but one could think of adding the correct sky frequencies as labels. The information could come form the prc-file, but as I tried that I gave up with observation that use more than one mode and one has to look which setup is used. Maybe I'll add this later.
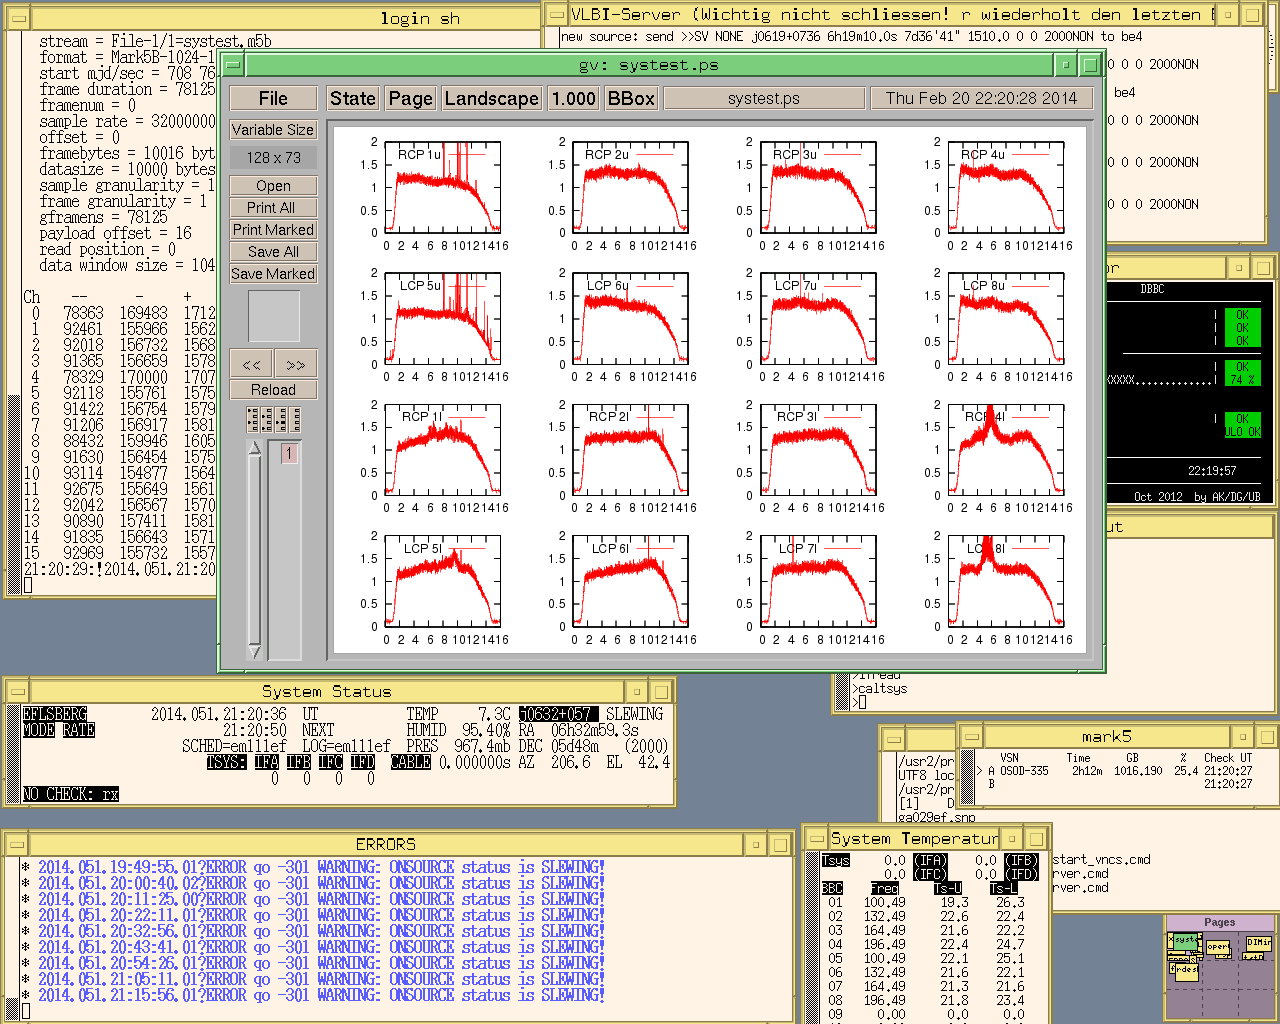
Fig. 1: Here is a snapshot of the FS screen during a 1 Gbps 18cm observation with a lot of RFI.
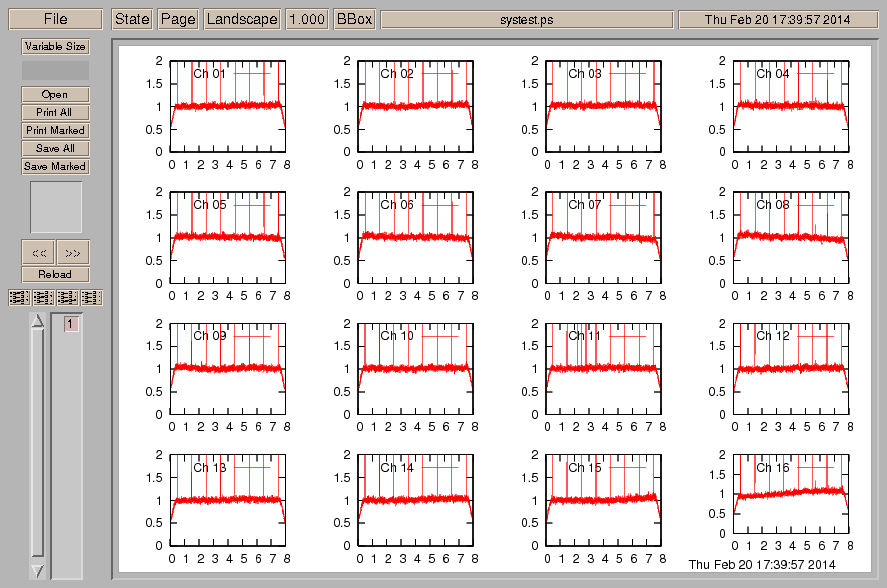
Fig. 2: This plot is from N13C1 with 8 MHz filters and phasecal on.
/@api/deki/files/4326/=mark5access-1.4.5.tar.gz
/@api/deki/files/4330/=checkdata.py
Acknowledgment
Thanks to Jonathan Quick for the initial idea and for sending me the mark5access package and some gnuplot scripts to look at DBBC data.
Checking Phases from the DBBC
The goal of this second section is to show a method to verify that the phases of the different channels in the DBBC are stable along time. We have developed this small test because we found that our DBBC at Yebes was producing fringes with lower quality than the ones obtained with the VLBA terminal. Besides phase jumps were seen during time at the correlator for some bands. The DBBC at Yebes is equipped with 4 IFs and 4 COREs.
The basic idea of the test is to connect the DBBC to a receiver with the phase cal on. In our case we used the X band and S band receiver feeding IFs 1 and 2 and 3 and 4 respectively. Then data are recorded for some minutes. Later some slots of data 2 seconds long and spaced 30 seconds or 1 minute are extracted in the Mark5B. bpcal is ran on top of the data and the phases for all channels are written on an ASCII file and plotted with gnuplot.
For the moment this check requires two procedures: one in the FS and one in the Mark5B.
- First procedure records data and extracts 2 seconds of data spaced which are stored in the mark5
- Second procedure goes over all files in Mark5B and extracts phases and amplitudes of the phasecal and plots the phases for all channels versus time